NQ: After the Bell 07/30/2025
The market tested 23400 demand and ripped into 23650 on short covering. Bias bullish into next session but watch 23680-23700 supply for fade setups.
Market session briefing for Wednesday:
📊 Nasdaq Futures Report
📆 Wednesday: July 30, 2025
🕓 Analysis Window: (18:00 → 17:00 ET) + higher timeframe structure
💡 Focus: Order intensity, intraday structure, and directional bias
🔍 Narrative Summary
Nasdaq futures opened the session near recent balance but quickly rotated lower after the ADP and GDP prints, finding strong responsive buying interest at the 23400 demand shelf. FOMC release at 14:00 ET triggered high-intensity two-way trade with heavy absorption near 23500 before a sharp selloff into 23390. Late-day recovery reclaimed 23650 into the close, signaling strong short-covering momentum.
Breakout buyers were met with supply absorption above 23660, suggesting sellers remain active at the upper end of the range. The session closed strong but extended, raising the probability of early pullback in the next session.
Bias: Near-term bullish with caution for fade setups against 23680-23750 supply.
📌 Note: FOMC at 2:00 PM
📌 Note: Red Folder Economic Events Last Session:
| Event | Date | Time (ET) |
|---|---|---|
| ADP Employment Change | 07/30/2025 | 08:15 |
| GDP Growth Rate QoQ | 07/30/2025 | 08:30 |
| FOMC | 07/30/2025 | 14:00 |
| FOMC Presser | 07/30/2025 | 14:30 |
📌 Note: Red Folder Economic Events Next Session:
| Event | Date | Time (ET) |
|---|---|---|
| UC Claims | 07/31/2025 | 08:30 |
| PCE Price Index YoY | 07/31/2025 | 08:30 |
| Personal Income & Spending | 07/31/2025 | 08:30 |
🔮 Thursday - Next Session Game Plan
📈 Base Case – Responsive Range
Open Inside 23500-23680
→ Expect fades from 23680-23700 into 23520-23500
→ Price likely oscillates around 23540 magnet zone
📉 Breakdown Risk
Loss of 23500
→ Clears Demand/support
→ Exposes 23440 → 23400 → 23360 → 23320 downside ladder
⚠️ 23400 (4H) = Trend demand zone or structural inflection
→ Watch for volume confirmation — avoid chasing into low-liquidity zones
🚀 Breakout Scenario
Sustained acceptance above 23700
→ Clears Supply/resistance
→ Opens path toward 23760 → 23820 → 23880 → 23940 upside ladder
⚠️ 23700 (1H) = Trend supply zone or structural inflection
→ Watch for volume confirmation — avoid chasing into low-liquidity zones
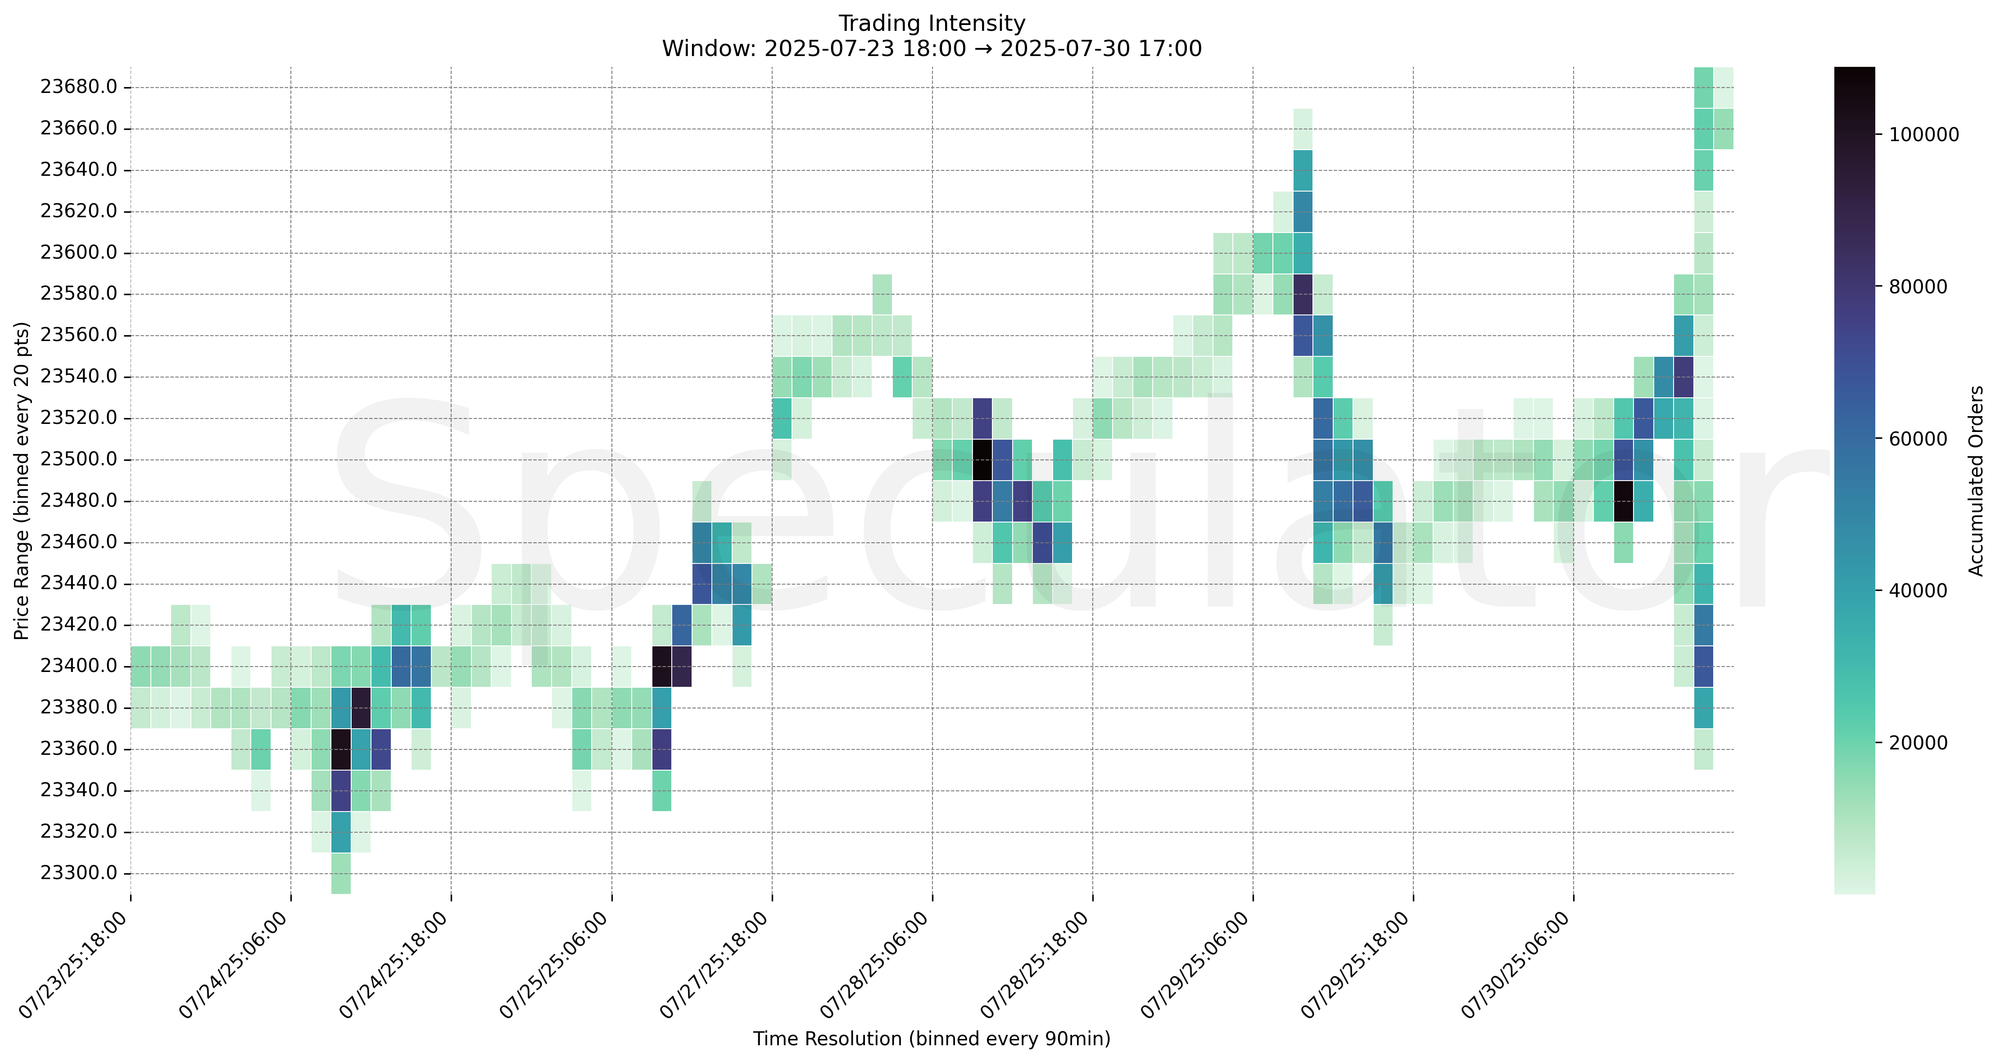
🧊 Key Heatmap Observations
🔹 23390 → 17,184 @ 07/30 15:00 – Strong responsive buying from demand shelf
🔹 23400 → 15,573 @ 07/30 15:00 – Heavy absorption into FOMC post-drop
🔹 23520 → 20,434 @ 07/30 10:30 – Breakout test met with heavy supply absorption
🔹 23480 → 16,031 @ 07/30 09:45 – Morning rejection high before intraday fade
🔧 Price Clusters by Timeframe
| Timeframe | Price Levels | Notes |
|---|---|---|
| 15min | 23500, 23490, 23480 | Intraday rotation points with responsive activity |
| 30min | 23490, 23475, 23520 | Short-term HVNs from morning and FOMC rotations |
| 1H | 23560, 23480, 23520 | Hourly structure highs/lows with high volume |
| 4H | 23400, 23450, 23500 | Major demand shelf and intermediate balance point |
| 1D | 22900, 23000 | Long-term composite demand and value zones |
| 2D | 22950, 22050, 21600 | Longer-term demand shelves and value migration |
📈 Stay objective. Trade your plan with context.