NQ: After the Bell 07/31/2025
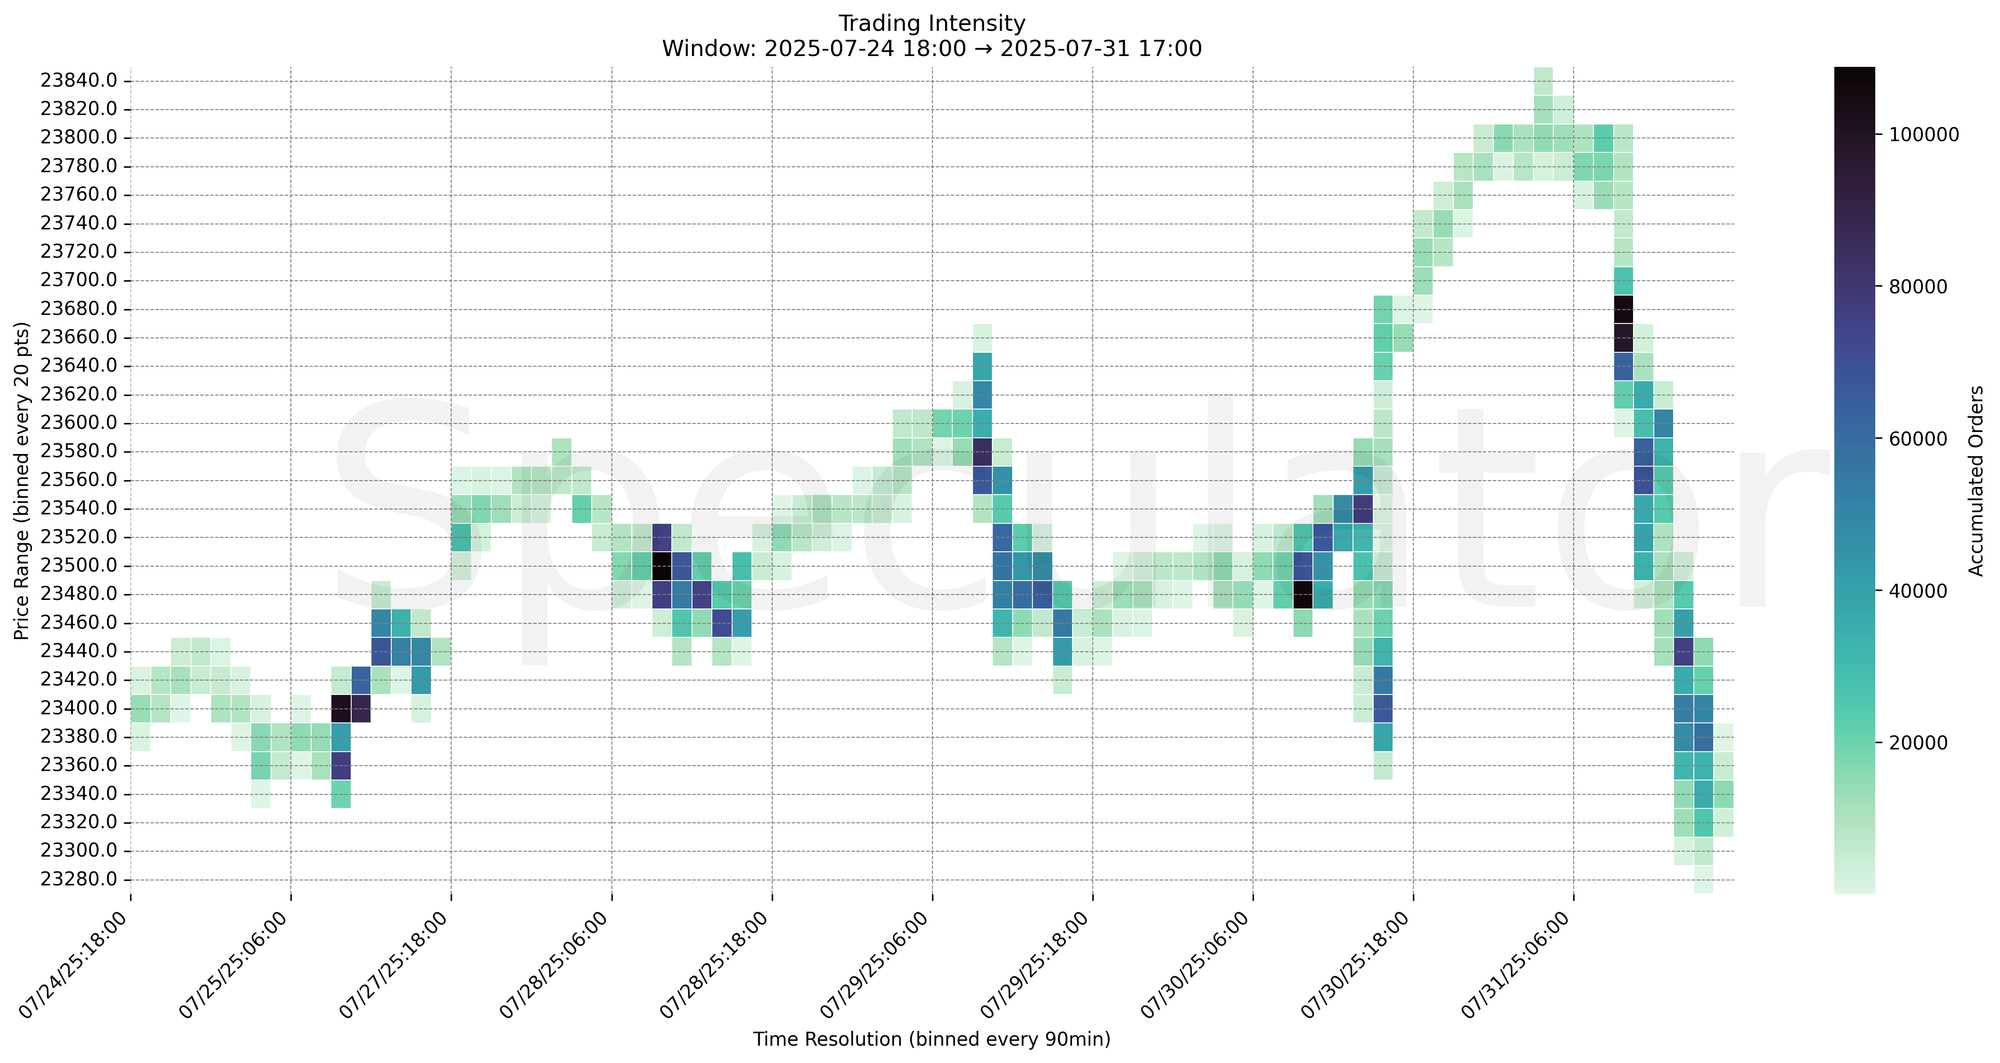
The market failed at 23,680 supply, reversing sharply into 23,320 support. Sellers hold bias unless 23,660 reclaimed.
Market session briefing for Thursday:
📊 Nasdaq Futures Report
📆 Thursday: July 31, 2025
🕓 Analysis Window: (18:00 → 17:00 ET) + higher timeframe structure
💡 Focus: Order intensity, intraday structure, and directional bias
🔍 Narrative Summary
Nasdaq futures opened firm but quickly found heavy supply overhead near 23,680, triggering a sharp reversal during the late session. Strong sell programs hit into high-volume demand shelves, with the most aggressive liquidation seen after 14:30 ET, cascading price lower into 23,320 support.
Early session buying failed to convert above the key supply band (23,660–23,680), and sellers pressed control into the close.
Bias shifted to defensive: next session opens with sellers holding the short-term upper hand unless 23,660 is reclaimed.
📌 Note: Red Folder Economic Events:
| Event | Date | Time (ET) |
|---|---|---|
| UC Claims | 07/31/2025 | 08:30 |
| PCE Price Index YoY | 07/31/2025 | 08:30 |
| Personal Income & Spending | 07/31/2025 | 08:30 |
📌 Note: Scheduled Red Folder Economic Events Next Session:
| Event | Date | Time (ET) |
|---|---|---|
| NFP | 08/01/2025 | 08:30 |
| Unemployment Rate | 08/01/2025 | 08:30 |
| PMI | 08/01/2025 | 08:30 |
| Michigan Consumer Sentiment | 08/01/2025 | 08:30 |
🔮 Friday - Next Session Game Plan
📈 Base Case – Responsive Range
Open Inside 23,500–23,600 zone
→ Expect fades from 23,660–23,680 into 23,520
→ Price likely oscillates around 23,540 magnet zone
📉 Breakdown Risk
Loss of 23,320
→ Clears Demand/support
→ Exposes 23,280 → 23,240 → 23,200 → 23,160
⚠️ 23,200 (4H) = Trend demand zone or structural inflection
→ Watch for volume confirmation — avoid chasing into low-liquidity zones
🚀 Breakout Scenario
Sustained acceptance above 23,680
→ Clears Supply/resistance
→ Opens path toward 23,720 → 23,760 → 23,800 → 23,840
⚠️ 23,800 (4H) = Trend supply zone or structural inflection
→ Watch for volume confirmation — avoid chasing into low-liquidity zones
🧊 Key Heatmap Observations
🔹 23,390 → 16,723 @ 07/31 15:30 – Late-session aggressive sell sweep into demand shelf
🔹 23,440 → 17,754 @ 07/31 14:30 – High-volume selling into mid-day low breakout
🔹 23,550 → 16,299 @ 07/31 13:00 – Selling failure to hold intraday recovery
🔹 23,500 → 21,953 @ 07/31 11:15 – Large offer absorption before breakdown leg
🔧 Price Clusters by Timeframe
| Timeframe | Price Levels | Notes |
|---|---|---|
| 15min | 23,680 / 23,620 / 23,570 / 23,500 / 23,440 / 23,390 | Short-term supply & demand pivots |
| 30min | 23,685 / 23,670 / 23,655 / 23,520 / 23,445 | Session supply caps and key breakdown zones |
| 1H | 23,480 / 23,520 / 23,540 / 23,400 / 23,680 / 23,660 | HVNs, intraday decision points |
| 4H | 23,500 / 23,475 | Major supply/demand clustering |
| 1D | 22,900 / 23,000 | Macro higher-volume nodes |
| 2D | 20,400 / 21,600 / 22,050 / 22,950 | Long-term composite structure reference |
📈 Stay objective. Trade your plan with context.