NQ: At the Bell 07/07/2025
The market rejected 23000 overnight, rotated lower then recovered to 22980. Watch 22990–23000 as resistance. Bias is cautiously bearish unless reclaimed.
Market briefing for the Monday RTH open:
📊 Nasdaq Futures Report
📆 Monday Open: July 07, 2025 @ 09:30 ET
🕓 Analysis Window: Overnight Globex (18:00 → 09:00 ET) + higher timeframe structure
💡 Focus: Order accumulation, intraday structure, and directional bias
🔍 Narrative Summary
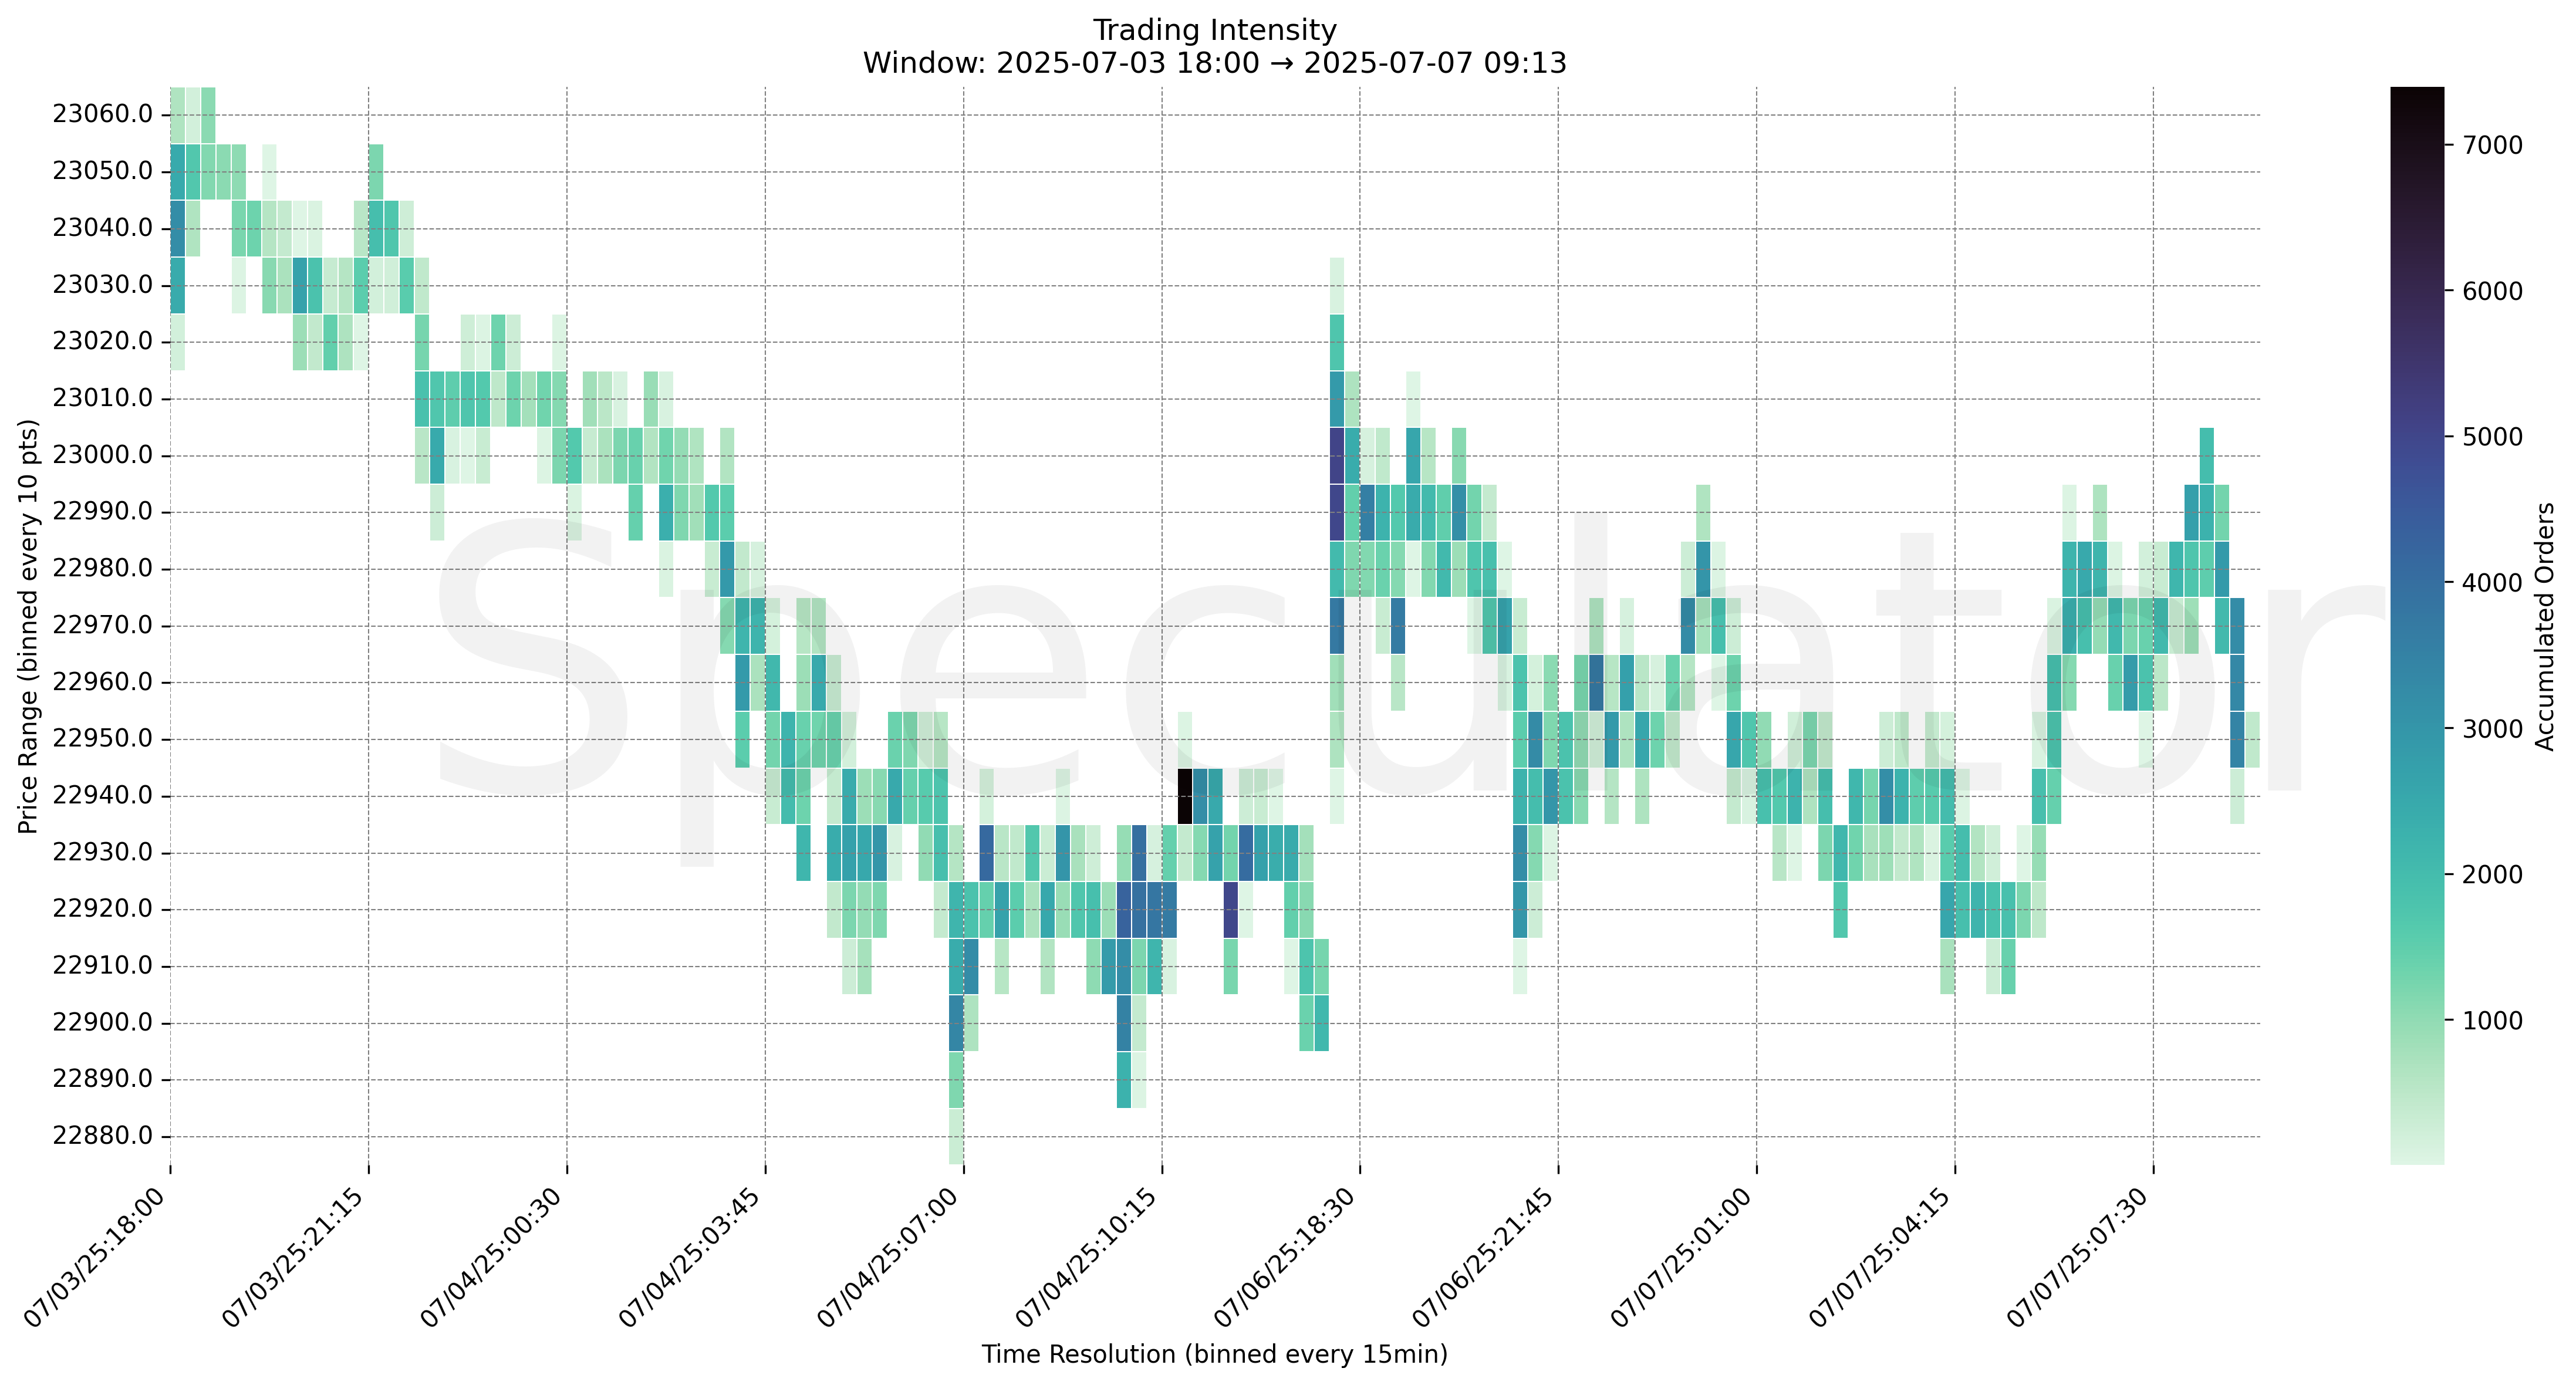
Overnight action on Nasdaq futures (MNQ) saw a responsive fade from the 23000–22990 area shortly after the Sunday open, marked by high order concentration. Price stair-stepped lower throughout the session, forming a clear descending structure into the 22920–22910 region, where some passive absorption was seen.
Notably, the highest trading intensity occurred right at the open at 23000, registering over 5000 orders in a single 10-point bracket — a strong sign of inventory accumulation or initial positioning.
Heading into RTH, buyers stepped in near 22930 and managed to rotate price back to test 22980–22990 into the early morning. This area now serves as a near-term supply shelf. With recent failure to hold above 23000, directional bias remains cautiously bearish unless reclaimed with volume.
No red folder events scheduled today, leaving technicals and order flow to drive action.
🔮 Monday Game Plan
📈 Base Case – Responsive Range
Open Inside 22940–22980 (30m cluster)
→ Expect fades from 22990–23000 into 22930–22920
→ Price likely oscillates around 22960–22965 magnet zone
📉 Breakdown Risk
Loss of 22920
→ Clears Demand/support
→ Exposes 22900 → 22860 → 22825 → 22800
⚠️ 22825 (4H) = Trend demand zone or structural inflection
→ Watch for volume confirmation — avoid chasing into low-liquidity zones
🚀 Breakout Scenario
Sustained acceptance above 23000
→ Clears Supply/resistance
→ Opens path toward 23040 → 23060 → 23080 → 23120
⚠️ 23080 (1H) = Trend supply zone or structural inflection
→ Watch for volume confirmation — avoid chasing into low-liquidity zones
🧊 Key Heatmap Observations
🔹 23000 → 5032 @ 07/06 18:00 – Highest concentration of opening orders; potential inventory build
🔹 22990 → 4983 @ 07/06 18:00 – Strong initial reaction level, likely passive seller response
🔹 22965 → 7493 @ 07/07 08:30 – Pre-RTH liquidity node, possible pivot zone
🔹 22960 → 3746 @ 07/06 22:15 – Price defended before late-session dip
🔹 22930 → 4068 @ 07/04 11:30 – Low-volume shelf retested in early morning rotation
🔹 22920 → 4976 @ 07/04 11:15 – Historical demand zone, watch for reaction
🔧 Price Clusters by Timeframe
| Timeframe | Price Levels | Notes |
|---|---|---|
| 15min | 22960, 22970, 22990, 23000 | Short-term reactive areas from Sunday session |
| 30min | 22920, 22935, 22965, 22995 | Prevalent liquidity bands pre-RTH |
| 1H | 22960, 23040, 23060, 23080 | HVNs & reactive structure near prior highs |
| 4H | 22800, 22725, 22825 | Demand zones from last week structure |
| 1D | 22100, 22000, 22700 | Macro higher timeframe levels |
| 2D | 19200, 19800, 20100, 20400, 21600, 22050 | Long-term mean-reversion & inflection zones |
📈 Stay objective. Trade your plan with context.