NQ: EOD 06/19/2025
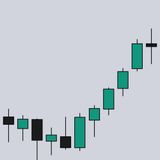
MNQ rallied early but flushed from 21730 to 21690 late in the session. Ended near 21700 with bearish tone into next session.
NQ - Post-Market Analysis 06/19/2025
Post-market briefing for the Thursday RTH open to close:
📊 MNQ Report
📆 Thursday: June 19, 2025
🕓 Analysis Window: Regular Trading Hours (09:30 → 13:00 ET) + higher timeframe structure
💡 Focus: Order accumulation, intraday structure, and directional bias
🔍 Narrative Summary
A compressed holiday session saw balanced-to-bullish development early, but the tone shifted sharply near the close. MNQ opened within prior value and briefly tested support near 21700 where buyers absorbed early pressure. Responsive demand lifted price steadily to a session high near 21755.
However, from 12:45 to 13:00, late-session selling reversed the entire mid-day advance. Price dropped sharply from 21730 to 21690, reclaiming only a minor bounce to 21700 into the early close. This abrupt shift points to end-of-day profit-taking or a liquidation event, and it leaves price vulnerable heading into the next session.
📌 Note: Today is a holiday (Juneteenth) and a partial trading day — the market closed early. Trade accordingly, manage risk.
🔮 Globex Game Plan
📈 Base Case – Responsive Range
Open Inside 21700–21740 zone
→ Expect fades from 21730 into 21700
→ Price likely oscillates around 21710 magnet zone
📉 Breakdown Risk
Loss of 21690
→ Clears Demand/support
→ Exposes 21660 → 21600 → 21500
⚠️ 21600 (2D) = Trend demand zone or structural inflection
→ Watch for volume confirmation — avoid chasing into low-liquidity zones
🚀 Breakout Scenario
Sustained acceptance above 21730
→ Clears Supply/resistance
→ Opens path toward 21830 → 21900 → 21975
⚠️ 22050 (2D) = Trend supply zone or structural inflection
→ Watch for volume confirmation — avoid chasing into low-liquidity zones
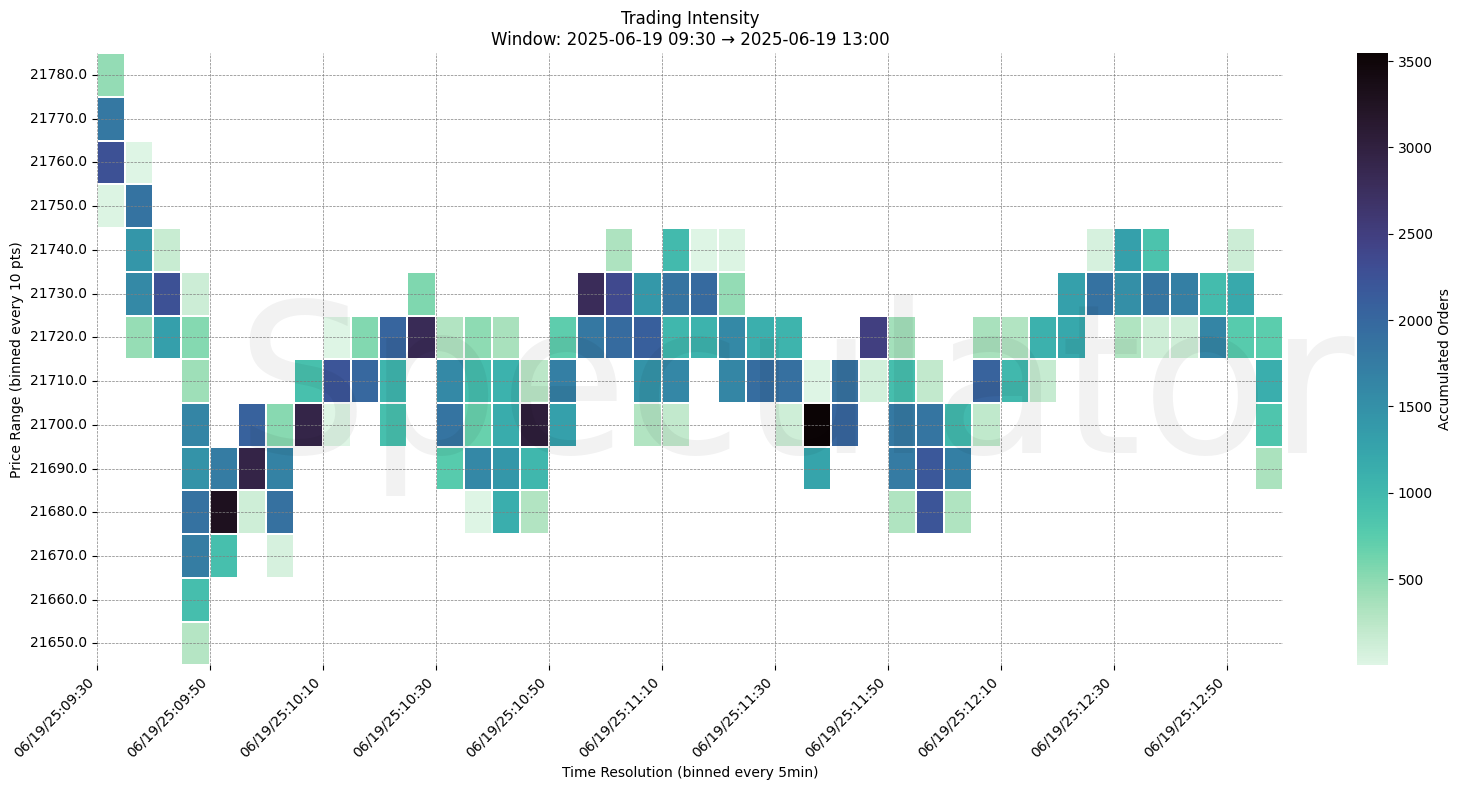
🧊 Key Heatmap Observations
🔹 21700 → 3500+ orders @ 09:45 – Heavy absorption followed by rotation higher
🔹 21730 → 3100+ orders @ 10:15 – Price bounced multiple times; strong buyers present
🔹 21740 → 2900+ orders @ 10:45 – Level flipped from resistance to support
🔹 21750 → 2700+ orders @ 11:15 – Acceleration point, buyers overwhelmed offers
🔹 21690 → 2400+ orders @ 12:55 – Sharp liquidation flush into the close
🔧 Price Clusters by Timeframe
| Timeframe | Price Levels | Notes |
|---|---|---|
| 15min | 21980, 21930, 21940, 22010, 22000 | Intraday liquidity and fade zones |
| 30min | 21930, 21945, 21960, 21975, 22035 | Session structure and control zones |
| 1H | 21940, 21980, 22020, 22060, 22100 | HVNs and reactive pivots |
| 4H | 21950, 22000, 22075, 22100, 22175 | Supply/resistance clustering and demand shelves |
| 1D | 22000, 22100, 21700, 21500 | Composite price memory |
| 2D | 22050, 21600, 20400, 20100, 19800 | Mean-reversion and structural context |
📈 Stay objective. Trade your plan with context.