NQ: Weekly Prep 28/2025
Weekly briefing:
📊 Nasdaq Futures Report
📆 27/2025:
🕓 Analysis Window: 27/2025:Sunday-Friday
🕓 Game Plan Window: 28/2025: Sunday-Friday
💡 Focus: Order accumulation, intraday structure, and directional bias
🔍 Narrative Summary
The Nasdaq futures traded within a volatile range last week as liquidity dried up ahead of the Independence Day holiday. Key accumulation surfaced between 22800–22840 early in the week, acting as a springboard for a sharp rally into the 23060–23090 zone. Notably, the rally lacked continuation, suggesting responsive selling near highs.
📌 Note: Last week (27) holidays (07/03 early close, 07/04 early closure – Independence Day).
📌 Note: Next week (28) Red Folder Economic Events.
| Event | Date | Time (ET) |
|---|---|---|
| FOMC Minutes | 07/09/2025 | 14:00 |
| UC Claims | 07/10/2025 | 08:30 |
🔮 Next Week (28/2025) Game Plan
📈 Base Case – Responsive Range
Open Inside 22900–23060
→ Expect fades from 23060–23090 into 22840–22880
→ Price likely oscillates around 22965–22980 (magnet zone)
📉 Breakdown Risk
Loss of 22800–22820
→ Clears Demand/support
→ Exposes 22725 → 22575 → 22500 → 22100
⚠️ 22575 (12H) = Trend demand zone or structural inflection
→ Watch for volume confirmation — avoid chasing into low-liquidity zones
🚀 Breakout Scenario
Sustained acceptance above 23090
→ Clears Supply/resistance
→ Opens path toward 23150 → 23300 → 23420 → 23600
⚠️ 23090 (15m) = Trend supply zone or structural inflection
→ Watch for volume confirmation — avoid chasing into low-liquidity zones
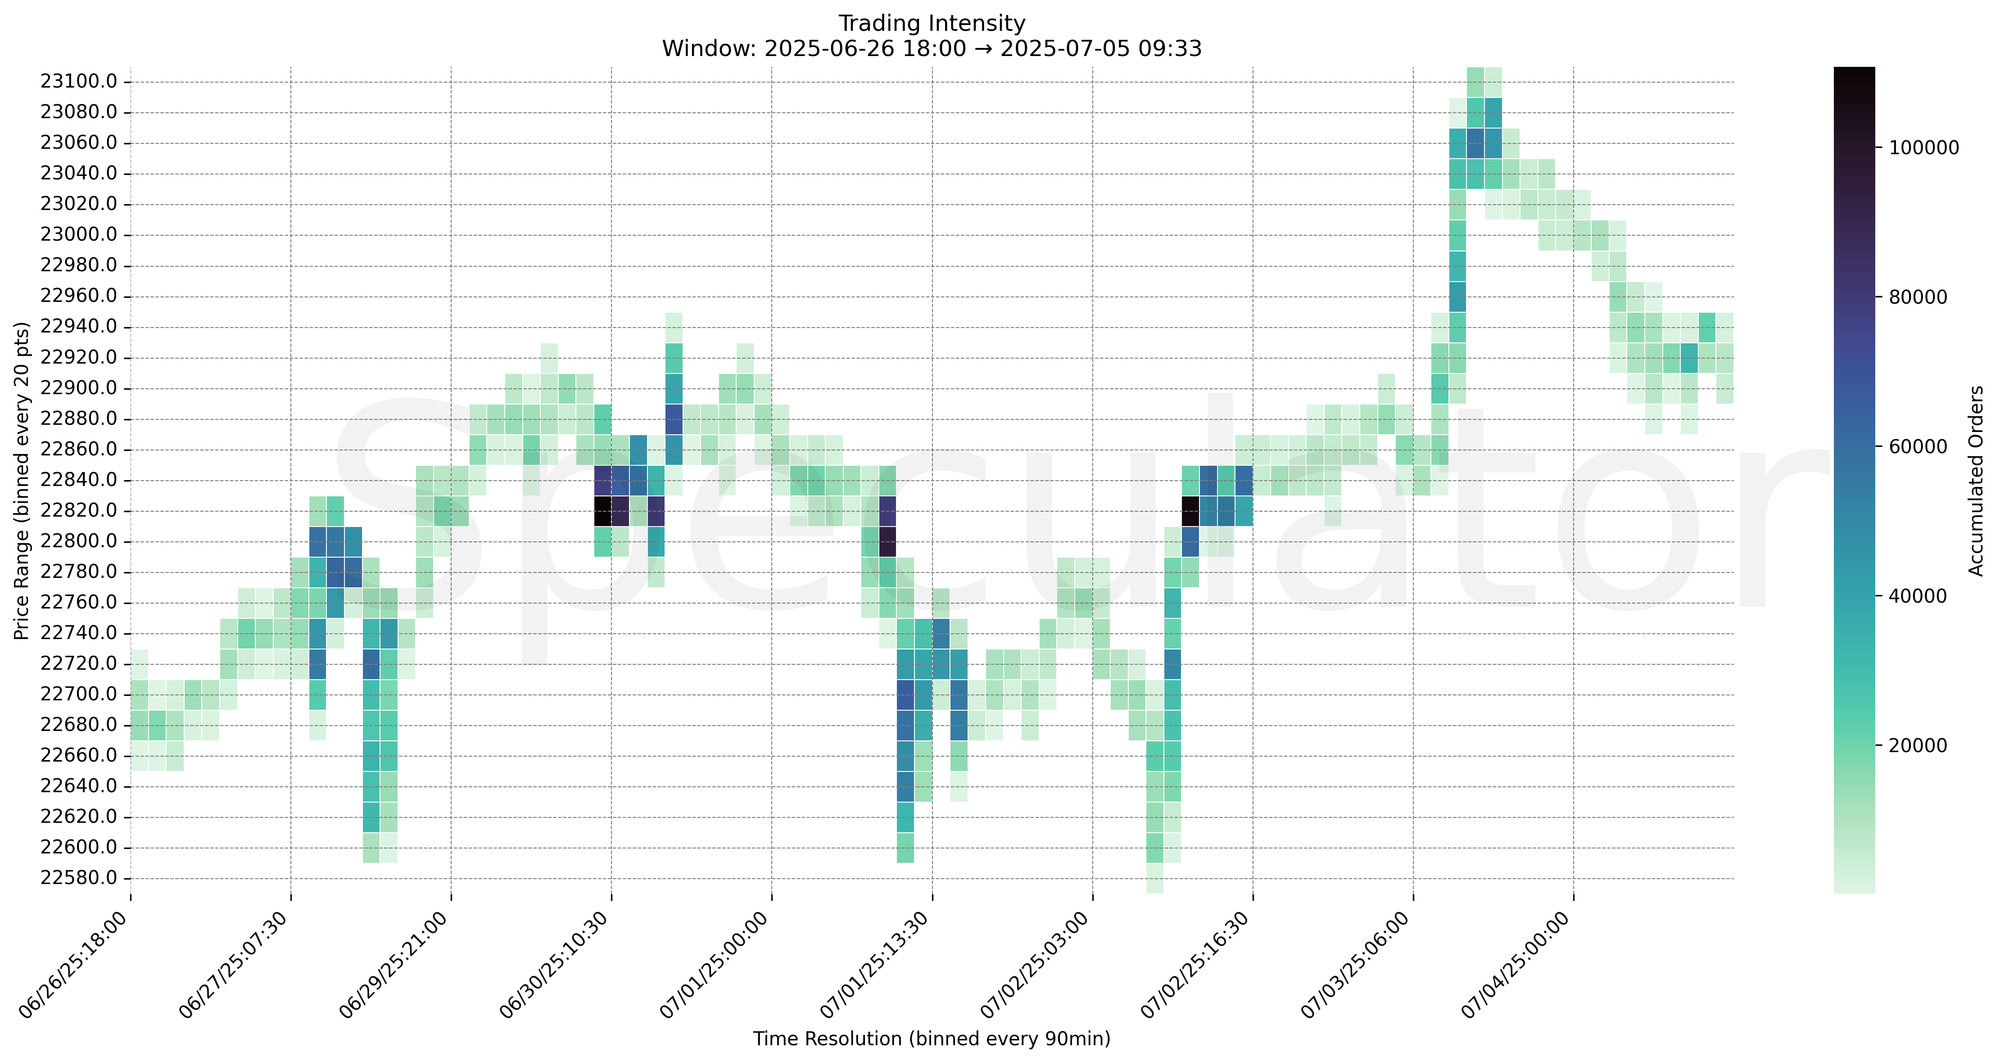
🧊 Key Heatmap Observations
🔹 22820 → 110682 @ 06/30 09:00 – Strong initiative drive launched from demand shelf
🔹 22965 → 40013 @ 07/03 09:30 – Major responsive zone held as key balance area
🔹 23060 → 19811 @ 07/03 12:45 – Absorption led to intraday reversal from supply
🔹 23055 → 36383 @ 07/03 10:00 – Upthrust capped by seller aggression
🔹 23070 → 26619 @ 07/03 12:30 – Liquidation began after this failed push
🔹 23085 → 23565 @ 07/03 12:00 – Supply stack formed just above recent highs
🔧 Price Clusters by Timeframe
| Timeframe | Price Levels | Notes |
|---|---|---|
| 15min | 23000, 22990, 23050, 23060 | Microstructure nodes from breakout/pullback phases |
| 30min | 22980, 22965, 23055, 23085 | Immediate auction edges, likely magnet levels |
| 1H | 22800, 22820, 22840, 23040, 23060 | HVNs and auction pivots across sessions |
| 4H | 22825, 22725, 22800 | Structural shelf and responsive demand zones |
| 1D | 22100, 22000, 22700 | Broader demand shelf + context from composite |
| 2D | 19200, 19800, 20100, 20400, 21600, 22050 | Long-term mean-reversion and major inflection levels |
📈 Stay objective. Trade your plan with context.