NQ: Weekly Prep 32/2025
The market lost the 23,680–23,660 zone last week, triggering a sharp liquidation into 22,850. Bearish bias into next week unless 23,300 reclaims.
Weekly Briefing:
📊 Nasdaq Futures Report
📆 31/2025:
🕓 Analysis Window: 31/2025: Sunday-Friday
🕓 Game Plan Window: 32/2025: Sunday-Friday
💡 Focus: Order intensity, structure, and directional bias
🔍 Narrative Summary
The Nasdaq futures broke sharply lower last week after early attempts to hold the 23,680–23,660 zone failed, triggering heavy sell programs and accelerating downside momentum. Selling pressure intensified on Thursday and Friday with significant order flow imbalances hitting key demand shelves. Price closed the week in the 22,880–22,850 region, a critical prior support now at risk of becoming resistance. No structural anomalies were noted outside of the aggressive liquidation sequence midweek.
Breakout/failure risk now centers on whether buyers can reclaim 23,000 and defend 22,850, or if sellers push through to expose deeper downside targets.
📌 Note: Next week Red Folder Economic Events:
| Event | Date | Time (ET) |
|---|---|---|
| PMI | 08/05 | 09:45 |
| ISM | 08/05 | 10:00 |
| Jobless Claims | 08/07 | 08:30 |
🔮 Next Week (32/2025) Game Plan
📈 Base Case – Responsive Range
Open Inside 22,880–23,000
→ Expect fades from 23,200–23,300 into 22,900–22,850
→ Price likely oscillates around 22,950–23,000 magnet zone
📉 Breakdown Risk
Loss of 22,850
→ Clears Demand/support
→ Exposes 22,720 → 22,600 → 22,450 → 22,300
⚠️ 22,600 (4H) = Trend demand zone or structural inflection
→ Watch for volume confirmation — avoid chasing into low-liquidity zones
🚀 Breakout Scenario
Sustained acceptance above 23,300
→ Clears Supply/resistance
→ Opens path toward 23,450 → 23,580 → 23,680 → 23,800
⚠️ 23,680 (1H) = Trend supply zone or structural inflection
→ Watch for volume confirmation — avoid chasing into low-liquidity zones
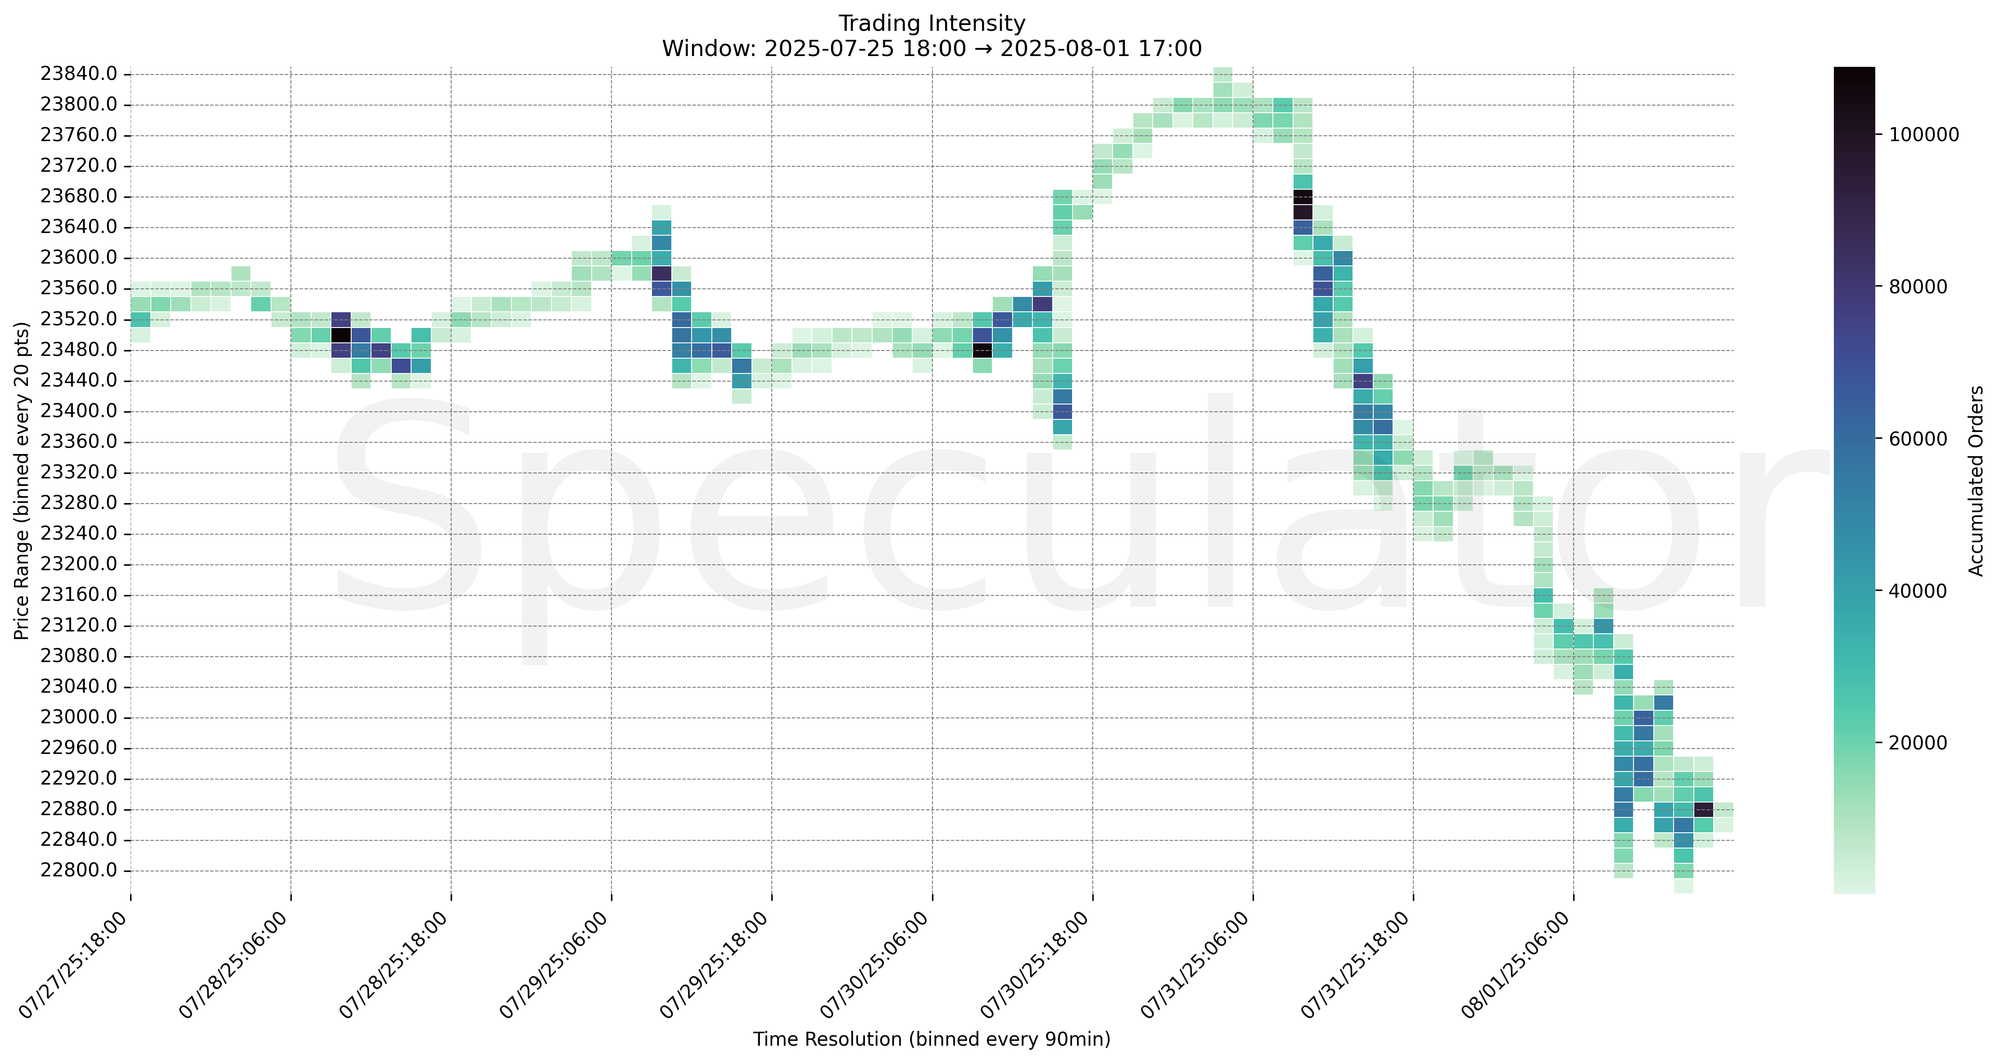
🧊 Key Heatmap Observations
🔹 22,880 → 94,666 @ 08/01 15:00 – Heavy absorption into the close, defending the 22,850 floor
🔹 23,680 → 104,607 @ 07/31 09:00 – Strong supply hit rejecting higher prices
🔹 23,500 → 108,791 @ 07/28 09:00 – Large sell imbalance initiating the week’s downtrend
🔹 23,440 → 75,822 @ 07/31 13:30 – Follow-through selling pressure reinforcing breakdown
🔧 Price Clusters by Timeframe
| Timeframe | Price Levels | Notes |
|---|---|---|
| 15min | 23,000 / 22,960 / 22,910 | Short-term micro-balance and reaction levels |
| 30min | 23,025 / 22,980 / 22,875 | Intraday HVNs and short-term responsive pivots |
| 1H | 23,680 / 23,660 / 22,880 | HVNs and structural rejection/absorption points |
| 4H | 23,575 / 23,475 / 22,875 | Supply shelves and demand pivots |
| 1D | 23,200 / 23,000 / 22,900 | Composite balance reference zones |
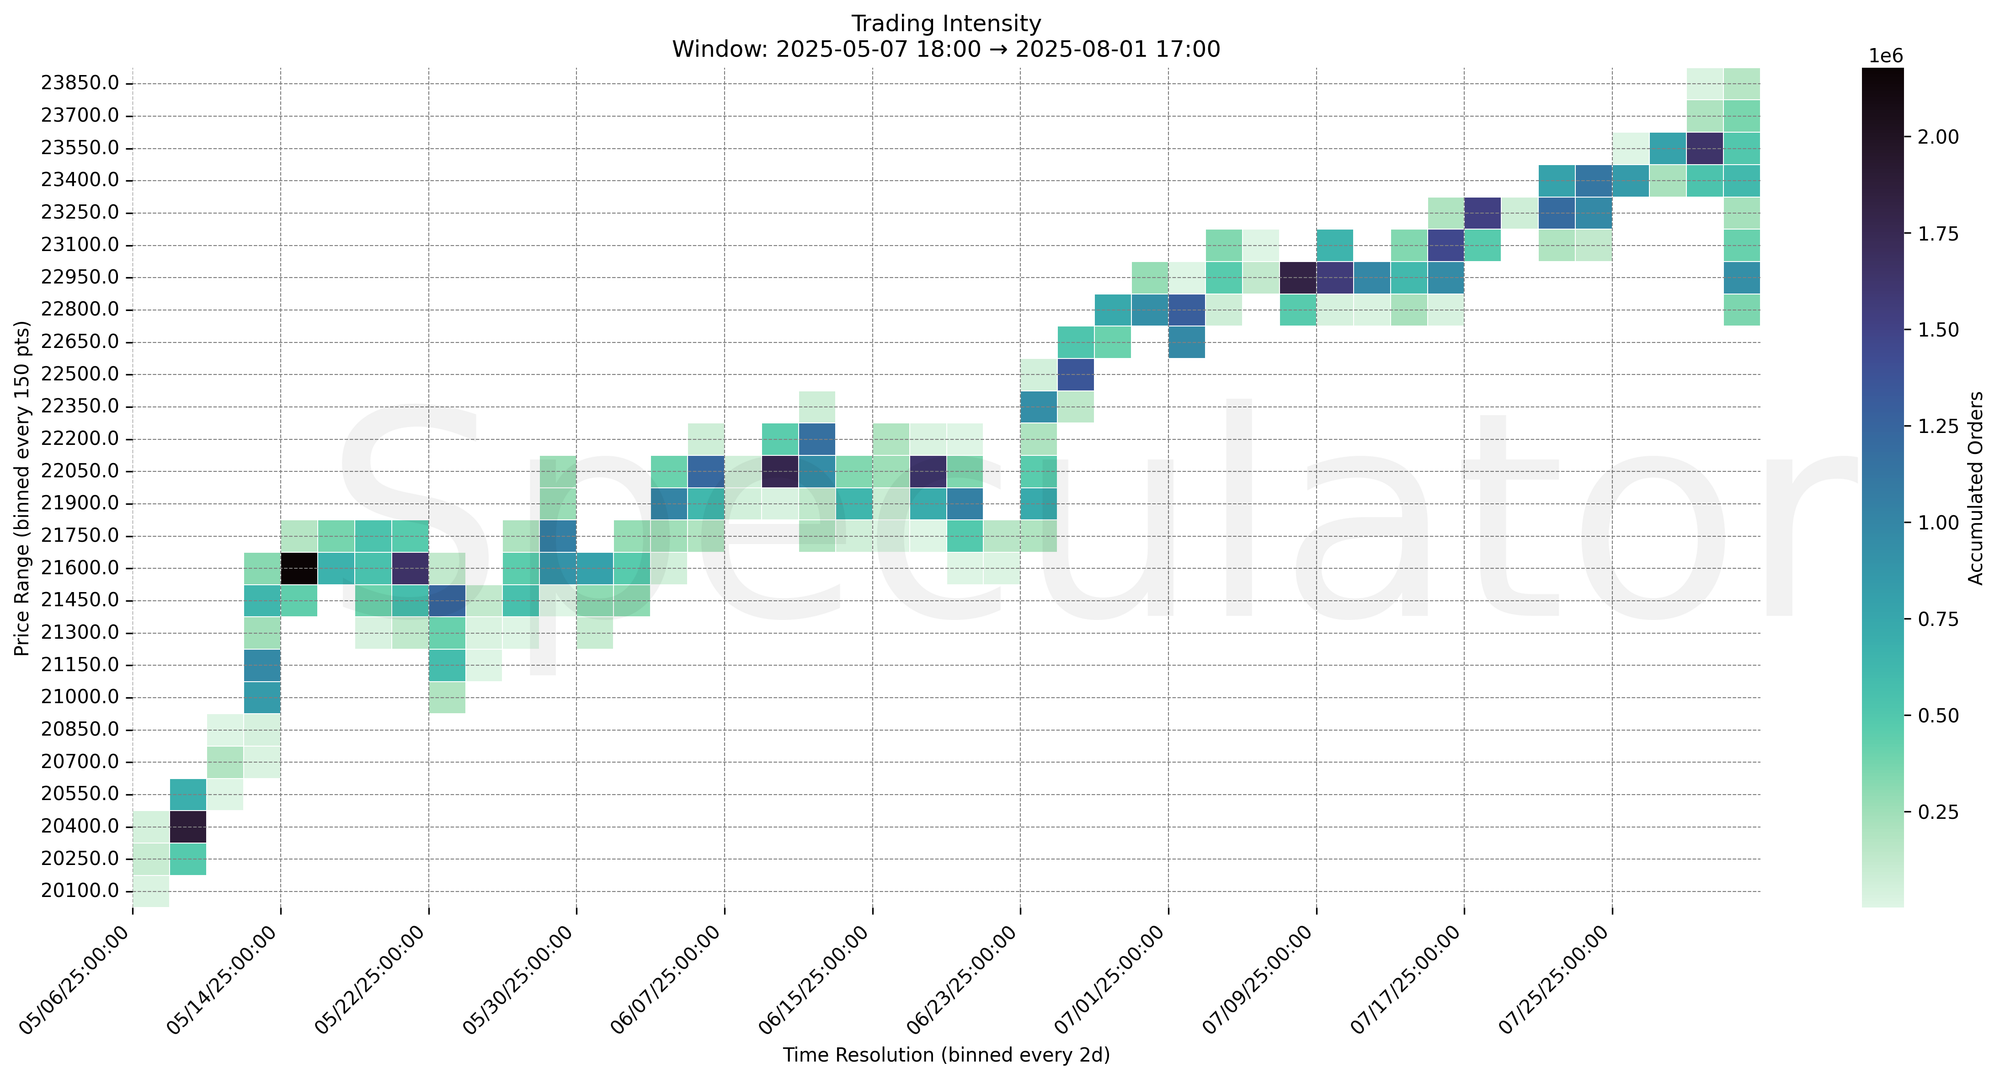
| 2D | 22,950 / 22,050 / 21,600 | Broader mean-reversion and macro demand/supply levels |
📈 Stay objective. Trade your plan with context.