NQ: Weekly Prep 36/2025
The market tested 23,800 supply last week, rejected, and rotated lower into 23,400 demand. Bias remains balanced-to-bearish into next week with breakdown risk.
Weekly Briefing:
📊 Nasdaq Futures Report
📆 36/2025:
🕓 Analysis Window: 35/2025: Sunday-Friday
🕓 Game Plan Window: 36/2025: Sunday-Friday
💡 Focus: Order intensity, structure, and directional bias
🔍 Narrative Summary
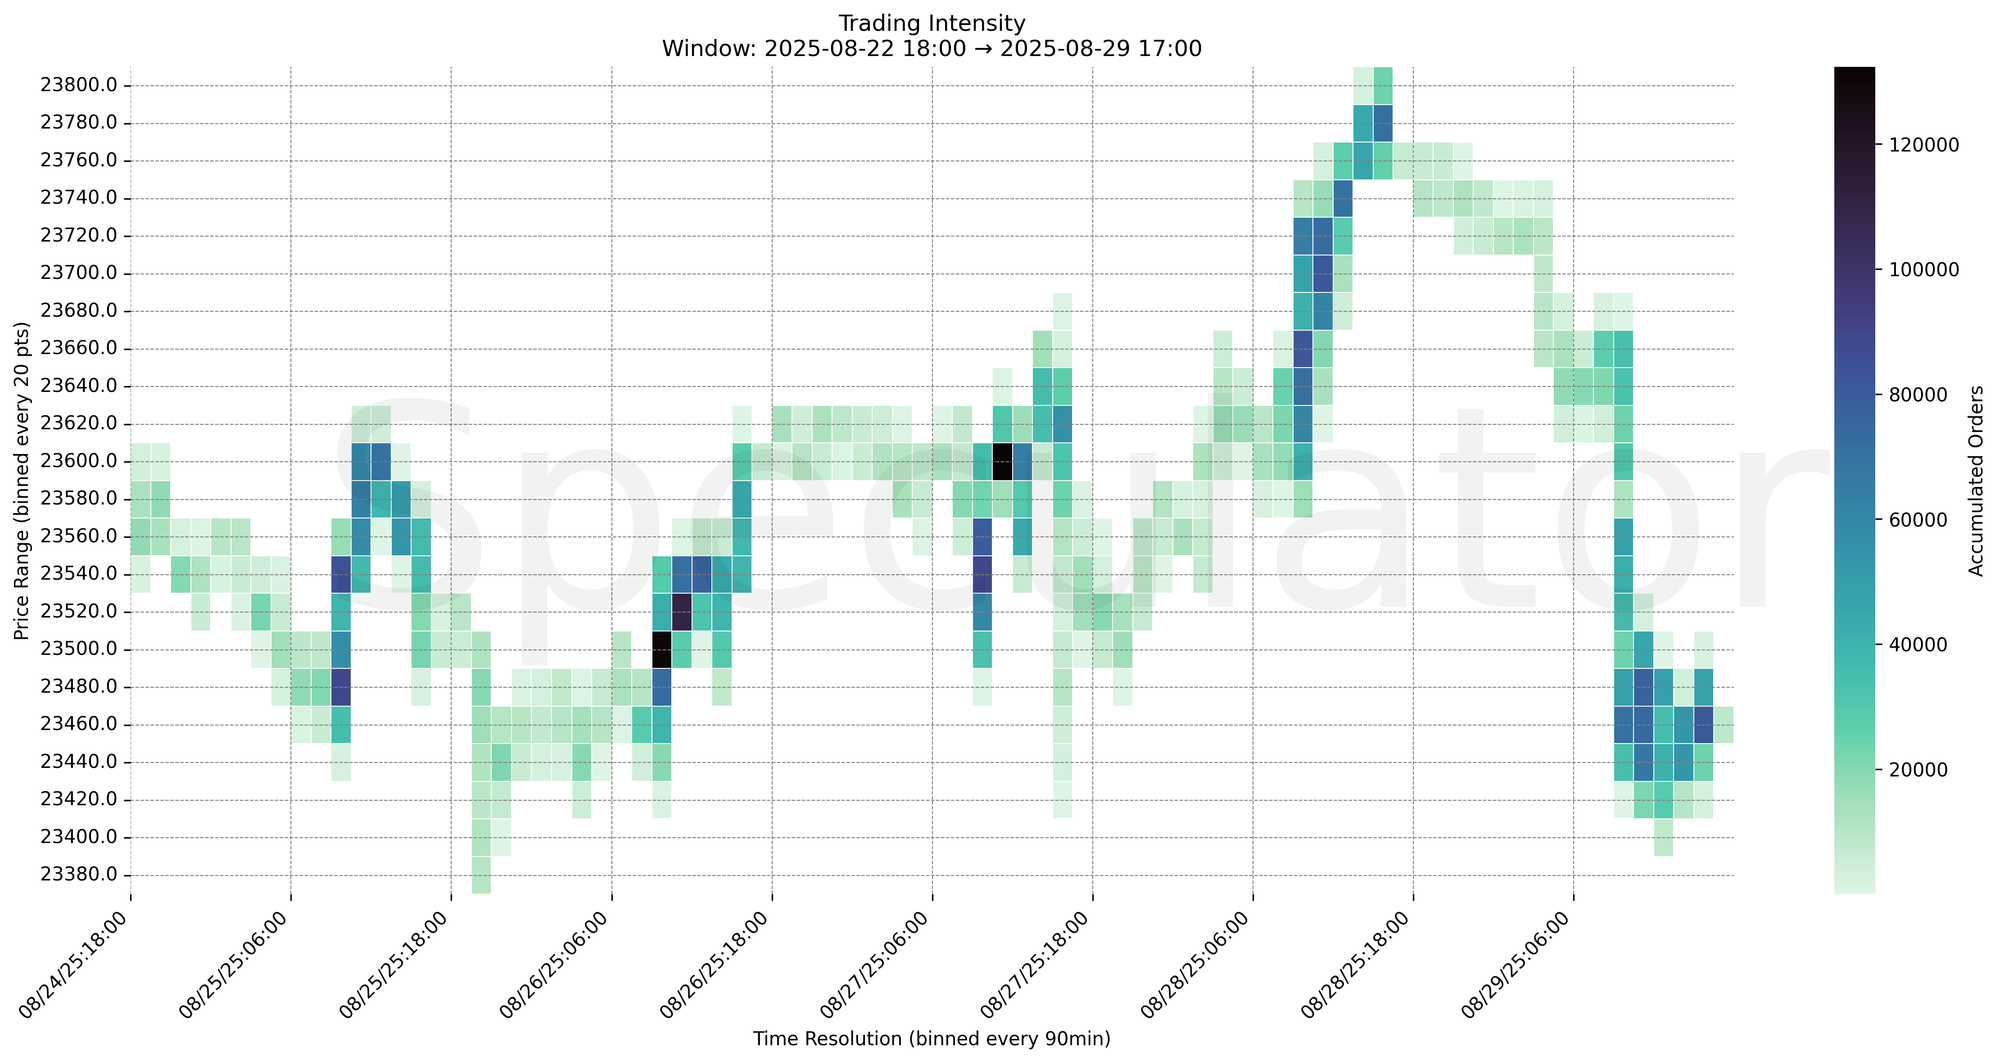
Nasdaq futures in week 35/2025 saw a choppy but directional rotation. Early pressure pushed prices down into the 23,400–23,500 demand shelf, where repeated high-intensity clusters formed. Responsive buyers stepped in aggressively, producing sharp rallies into the 23,760–23,800 supply area, which capped upside progress.
The tape showed multiple failures at higher prices, but sustained absorption kept the market bid until late in the week when sellers forced a decisive breakdown back into 23,400–23,500. This zone remains the key magnet for price.
Bias last week leaned balanced-to-bearish, with selling pressure prevailing late. For week 36/2025, the bias shifts to responsive range with downside risk, especially if 23,400 breaks cleanly.
📌 Note: Holidays (Labor Day – Monday 09/01/2025).
📌 Note: Next week Red Folder Economic Events:
| Event | Date | Time (ET) |
|---|---|---|
| Manufacturing PMI | 09/02 | 09:45 |
| Manufacturing ISM | 09/02 | 10:00 |
| Jolts | 09/03 | 10:00 |
| ADP | 09/04 | 08:15 |
| UC Claims | 09/04 | 08:30 |
| Services PMI | 09/04 | 09:45 |
| Services ISM | 09/04 | 10:00 |
| NFP | 09/05 | 08:30 |
| Unemployment Rate | 09/05 | 08:30 |
🔮 Next Week (36/2025) Game Plan
📈 Base Case – Responsive Range
Open Inside 23,400–23,500
→ Expect fades from 23,760–23,800 back into 23,400–23,500
→ Price likely oscillates around the 23,500 magnet zone
📉 Breakdown Risk
Loss of 23,400
→ Clears Demand/support
→ Exposes 23,300 → 23,200 → 23,000 → 22,950
⚠️ 23,200 (4H) = Trend demand zone or structural inflection
→ Watch for volume confirmation — avoid chasing into low-liquidity zones
🚀 Breakout Scenario
Sustained acceptance above 23,800
→ Clears Supply/resistance
→ Opens path toward 23,900 → 24,000 → 24,200 → 24,350
⚠️ 23,900 (1D) = Trend supply zone or structural inflection
→ Watch for volume confirmation — avoid chasing into low-liquidity zones
🧊 Key Heatmap Observations
🔹 23,460 → 83,537 @ 08/29 10:00 – Heavy absorption, sellers defended breakdown attempt
🔹 23,780 → 70,459 @ 08/28 15:00 – Strong rejection, capped upside momentum
🔹 23,660 → 79,504 @ 08/28 10:00 – Mid-session fade, liquidity pocket
🔹 23,540 → 83,515 @ 08/25 09:00 – Strong open drive defense
🔧 Price Clusters by Timeframe
| Timeframe | Price Levels | Notes |
|---|---|---|
| 15min | 23,640 / 23,600 / 23,560 | Intraday responsive levels, short-term reaction zones |
| 30min | 23,550 / 23,490 / 23,460 | Clustered demand from Friday morning |
| 1H | 23,780 / 23,660 / 23,460 | High-volume rejection and absorption zones |
| 4H | 23,600 / 23,500 / 23,450 | Midweek demand/supply shelves |
| 1D | 23,900 / 23,200 / 23,500 | Composite HVNs guiding directional bias |
| 2D | 22,950 / 23,250 / 23,850 | Macro balance areas, longer-term inflection |
📈 Stay objective. Trade your plan with context.