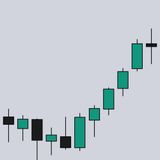
Figure Chart Analysis (Cause and Price Objectives)
Measuring the size of the accumulation or distribution cause to project the price objective of the subsequent effect. The figure chart is the cause-counting instrument. Covers: What Figure Chart Analysis Measures; The Law It Embodies; Context in the Analytical Hierarchy; Chart Construction: The 1-Po